矩阵显示
通过图形显示矩阵信息,依据图像颜色反映矩阵各个位置上的数值大小
函数定义
matplotlib.pyplot.matshow(A, fignum=None, **kwargs)
- 参数
A表示将要图形化的数组 - 参数
fignum指定图形窗口 - 默认为
None,表示新建一个窗口进行绘制 - 如果为非零整数,那么将绘制到该窗口(如果不存在则新建)
- 如果为
0,那么使用当前窗口(如果不存在则新建)
示例
参考:Matshow
import matplotlib.pyplot as plt
import numpy as np
import warnings
warnings.filterwarnings("ignore")
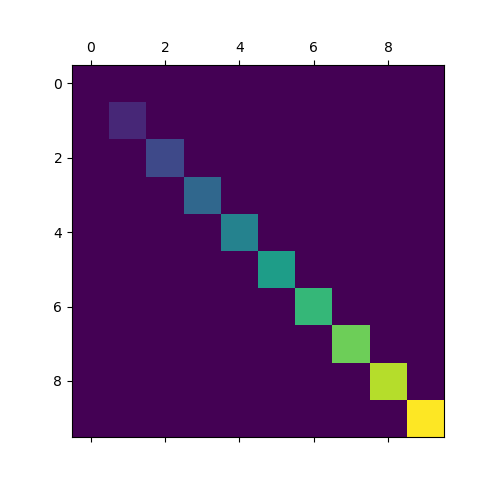
def samplemat(dims):
"""Make a matrix with all zeros and increasing elements on the diagonal"""
aa = np.zeros(dims)
for i in range(min(dims)):
aa[i, i] = i
return aa
ma = samplemat((10, 10))
print(ma)
# Display matrix
plt.matshow(ma)
plt.show()
输出矩阵信息:
[[0. 0. 0. 0. 0. 0. 0. 0. 0. 0.]
 [0. 1. 0. 0. 0. 0. 0. 0. 0. 0.]
 [0. 0. 2. 0. 0. 0. 0. 0. 0. 0.]
 [0. 0. 0. 3. 0. 0. 0. 0. 0. 0.]
 [0. 0. 0. 0. 4. 0. 0. 0. 0. 0.]
 [0. 0. 0. 0. 0. 5. 0. 0. 0. 0.]
 [0. 0. 0. 0. 0. 0. 6. 0. 0. 0.]
 [0. 0. 0. 0. 0. 0. 0. 7. 0. 0.]
 [0. 0. 0. 0. 0. 0. 0. 0. 8. 0.]
 [0. 0. 0. 0. 0. 0. 0. 0. 0. 9.]]